Primary Research
DM3107
Introduction.
For my primary research I decided to release a survey to try and identify the video game participants found to have the most problematic representations (Appendix 13).
To try and reach as many people as possible, I advertised my survey across many different platforms. I utilised my social media presence from the Year 2 Social Media Module to try and expose my survey to a wider audience.
Sending out the survey:
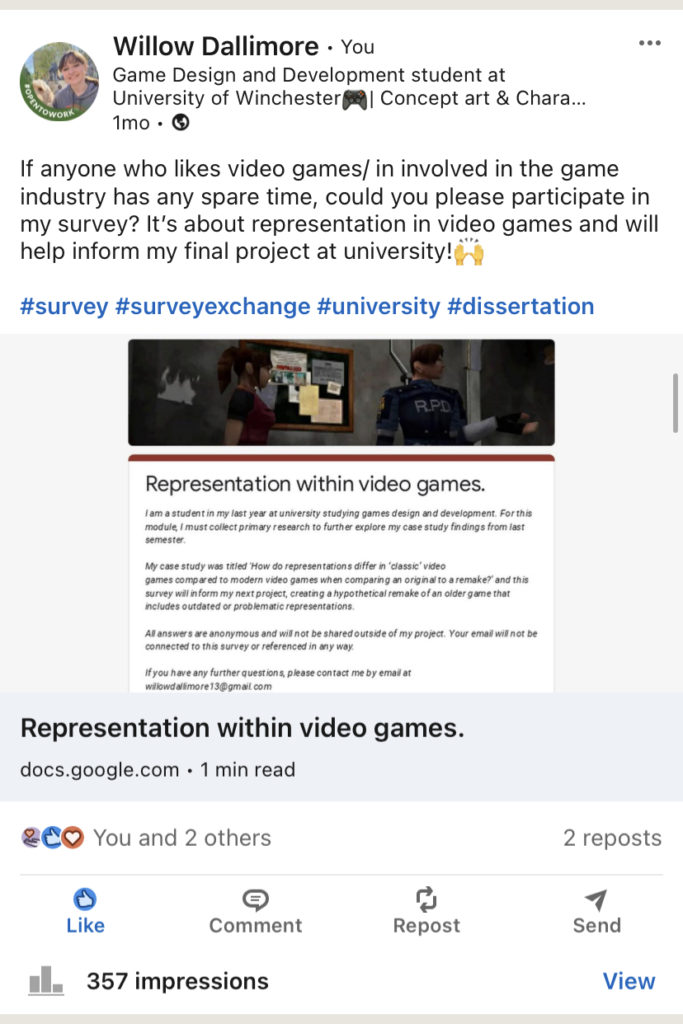
I put the survey on my Instagram story three times and made these stories into a highlight to ensure more people could view them (Appendix 1, Appendix 2, Appendix 3). I also posted the link on Linkedn four times, once as a regular post, once as a post in a game development group and then in two different survey exchange groups (Appendix 4, Appendix 5, Appendix 6, Appendix 8). I also joined a Facebook survey exchange group and swapped surveys with a few other members and posted my survey in the University Discord server (Appendix 7).
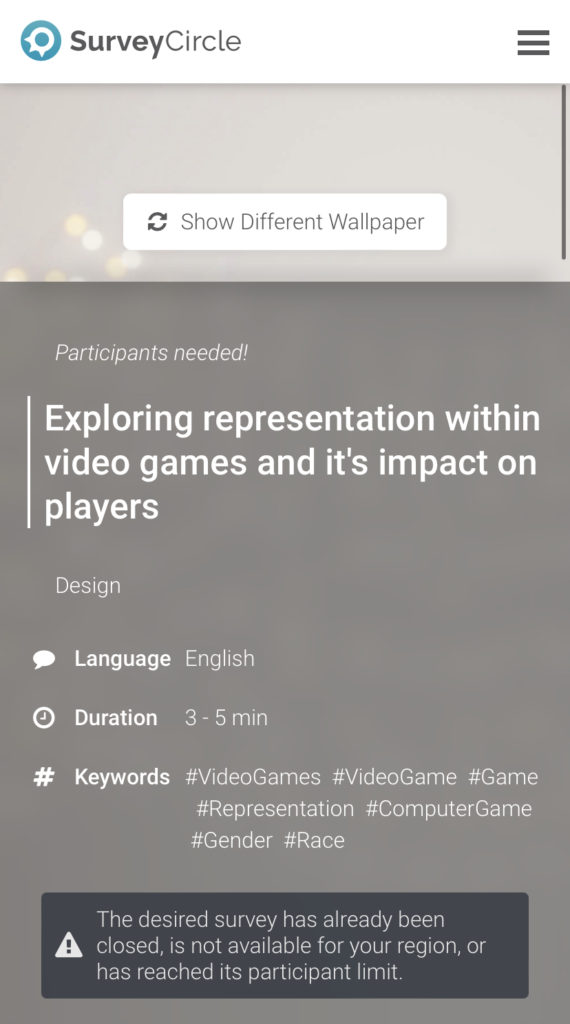
My survey still did not have an overwhelming number of responses, so I signed up for SurveyCircle, a site in which you can upload your survey link and it gets sent to other members to complete for points (Appendix 9).
I signed up and completed a few other surveys to boost mine on the algorithm, I also made some more social media posts – this time using the SurveyCircle link- however this did not gain me a single participant.
Ultimately, I had to close my survey with 18 participants since I needed to move onto my next task as outlined in my time management plan.
However, according to La Masson (2023) a survey is considered successful if anywhere between 5-30% of people who were sent the survey responded to it. Adding my Instagram followers (241), my LinkedIn connections (77) and the number of people in the University Discord server (61) equals 379 – 5% of which is 18.95. This is only slightly higher than my number or responses, 18, which means the data will be relatively well informed by La Masson’s definition.
Results:
(Appendix 14).
Firstly, I asked participants their gender identity and age. I included these questions since, in my case study, I had identified that age and gender can often be related to whether or not individuals viewed certain representations as problematic – giving me insight into the participants answers.
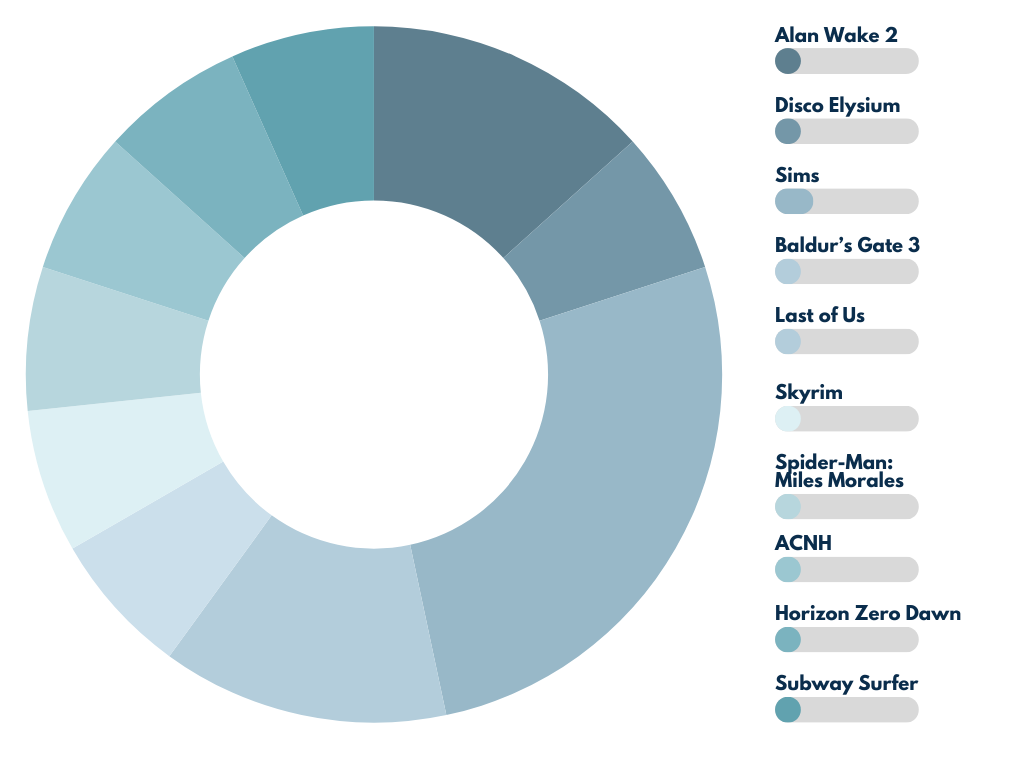
One section of the survey asked participants to identify any existing game that they felt had the best representation of elements such as gender, race, sexuality etc. The responses for this question were extremely varied, Sims had the highest number of votes with only 4/18 participants choosing it.
Participants were then asked to identify the game they felt had the worst representation of these elements.
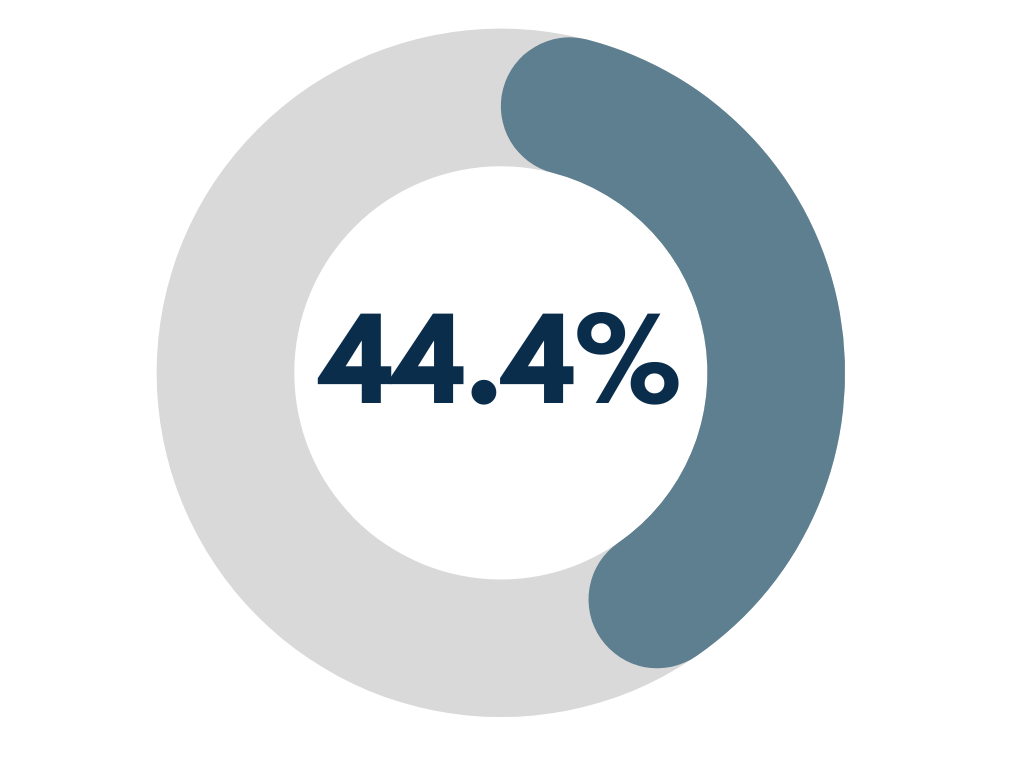
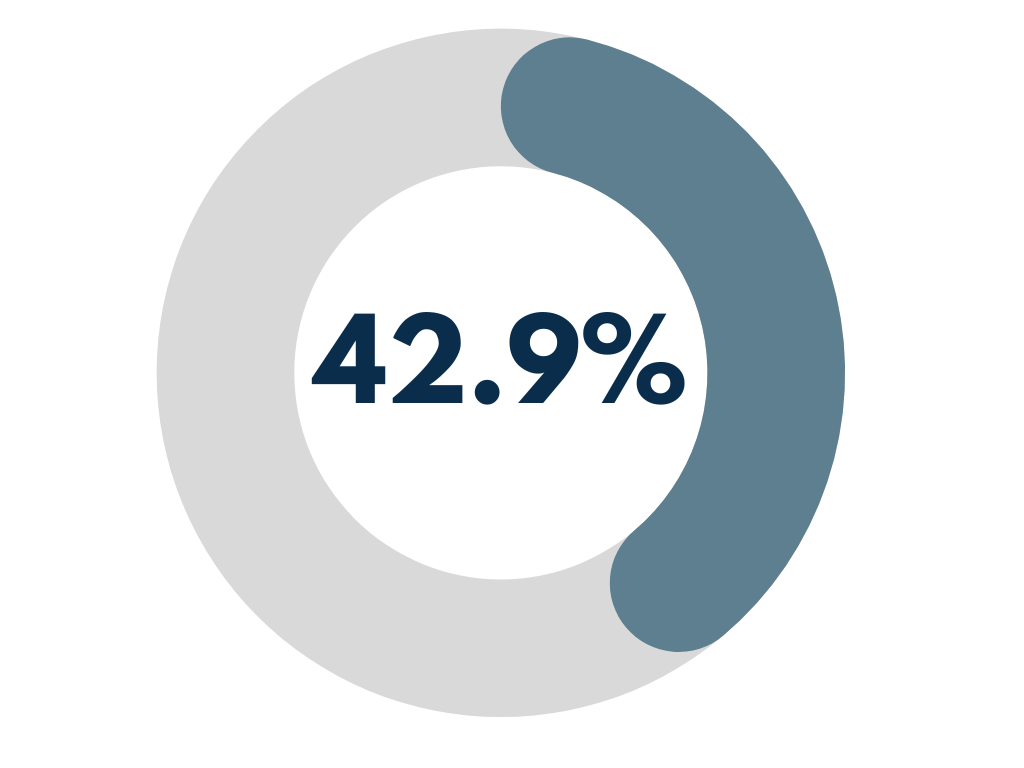
A unified 44.4% of participants agreed that the Grand Theft Auto series included the most problematic representations. This is double the percentage of participants who chose Sims as the game with the BEST representation (22.2%) – showing how the representations with GTA are a universally identified issue.
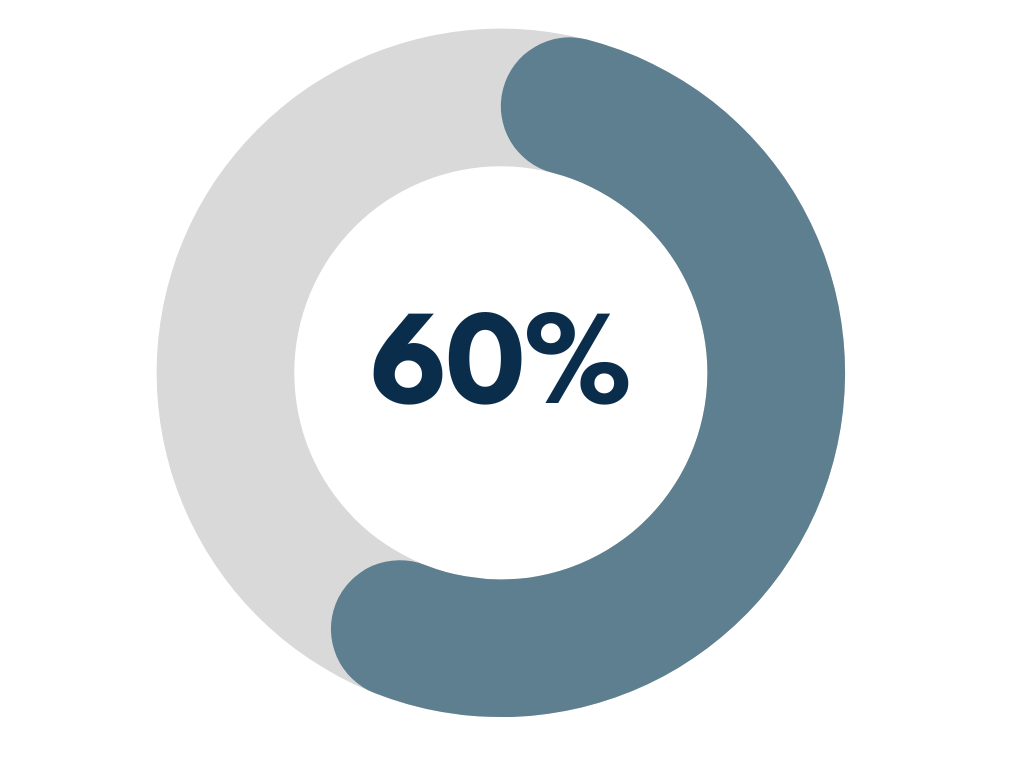
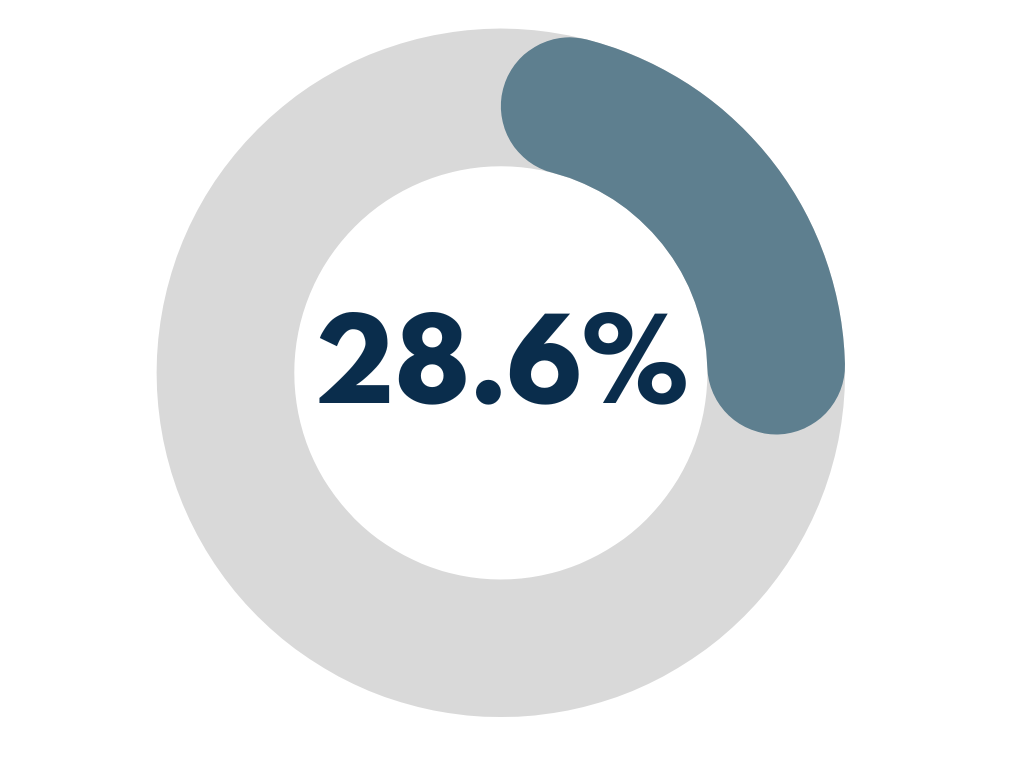
60% of female participants chose GTA and 28.6% of men chose GTA.
The cause that most participants identified, when explaining their choice of GTA was the particularly harmful representation of women. Some participants also suggested the game plays too heavily into racial stereotypes and includes homophobic dialogue and themes.
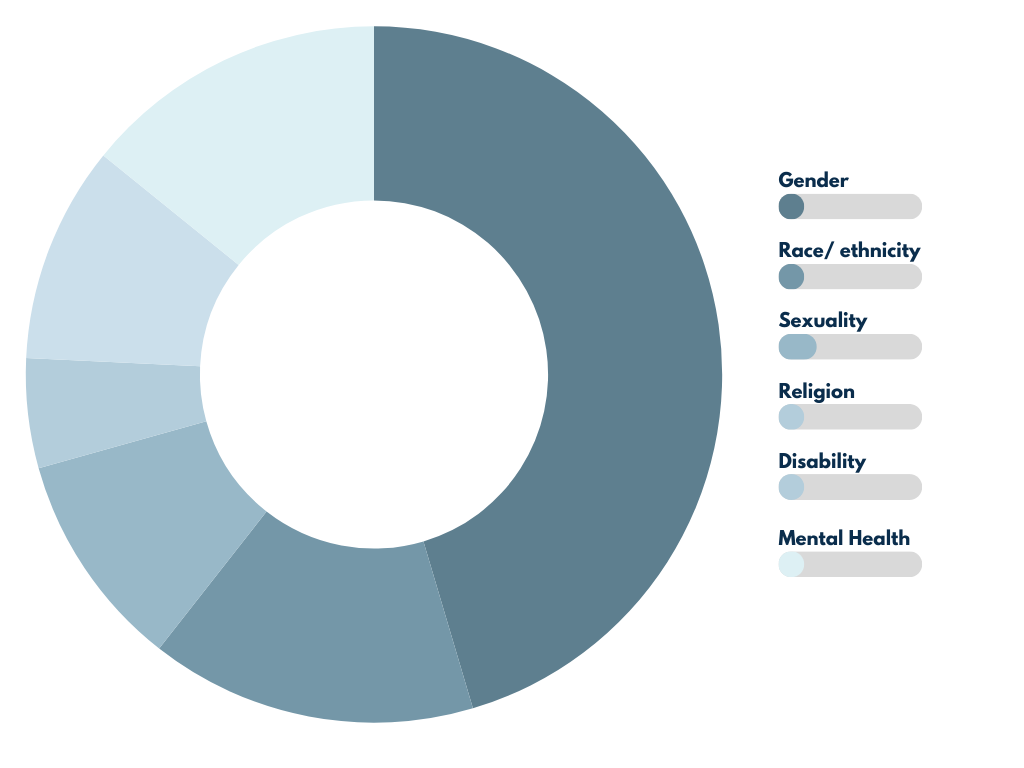
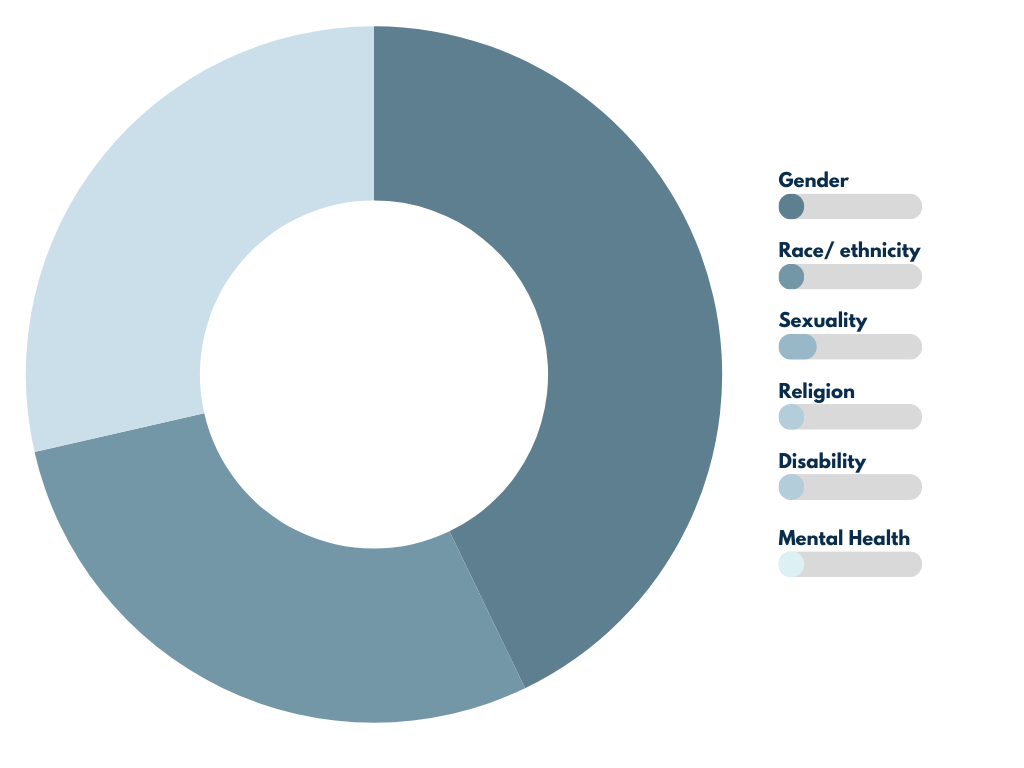
Most problematic element of representation.
Area of representation participants felt are most commonly represented problematically. Most participants felt the representation of gender in video games is usually the most harmful.

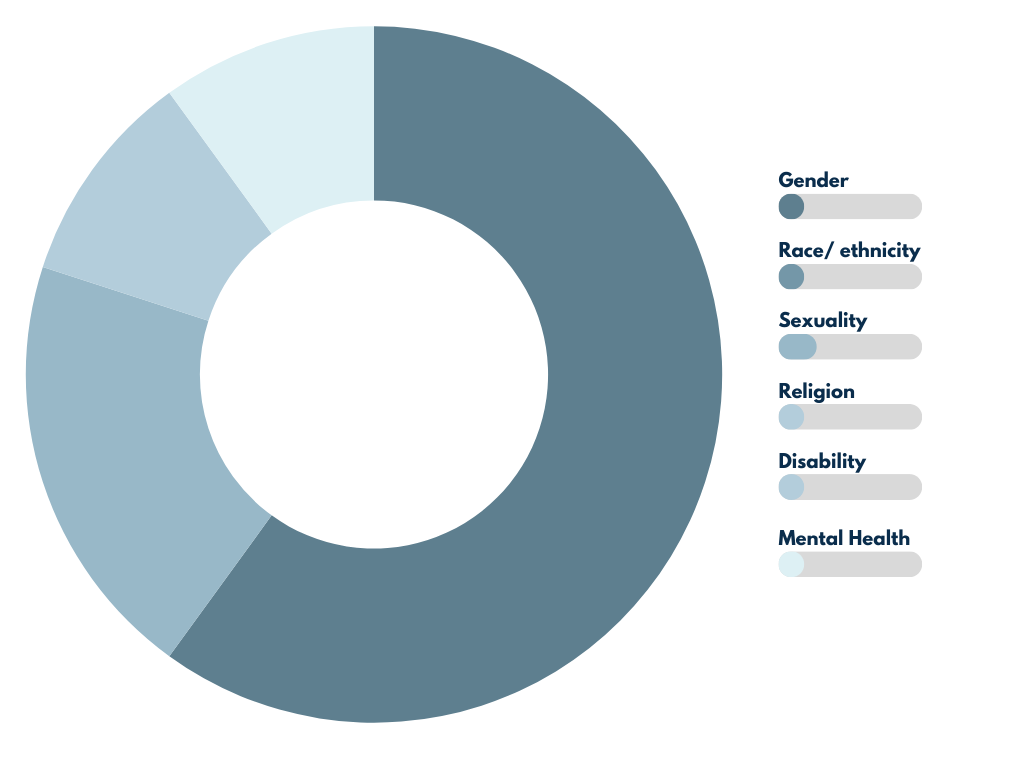
Male participants’ answers:
Female participants’ answers:
Should problematic content be removed from video game remasters?
Area of representation participants felt are most commonly represented problematically. Most participants felt the representation of gender in video games is usually the most harmful.
Should problematic content be removed from video game remakes?
Area of representation participants felt are most commonly represented problematically. Most participants felt the representation of gender in video games is usually the most harmful.
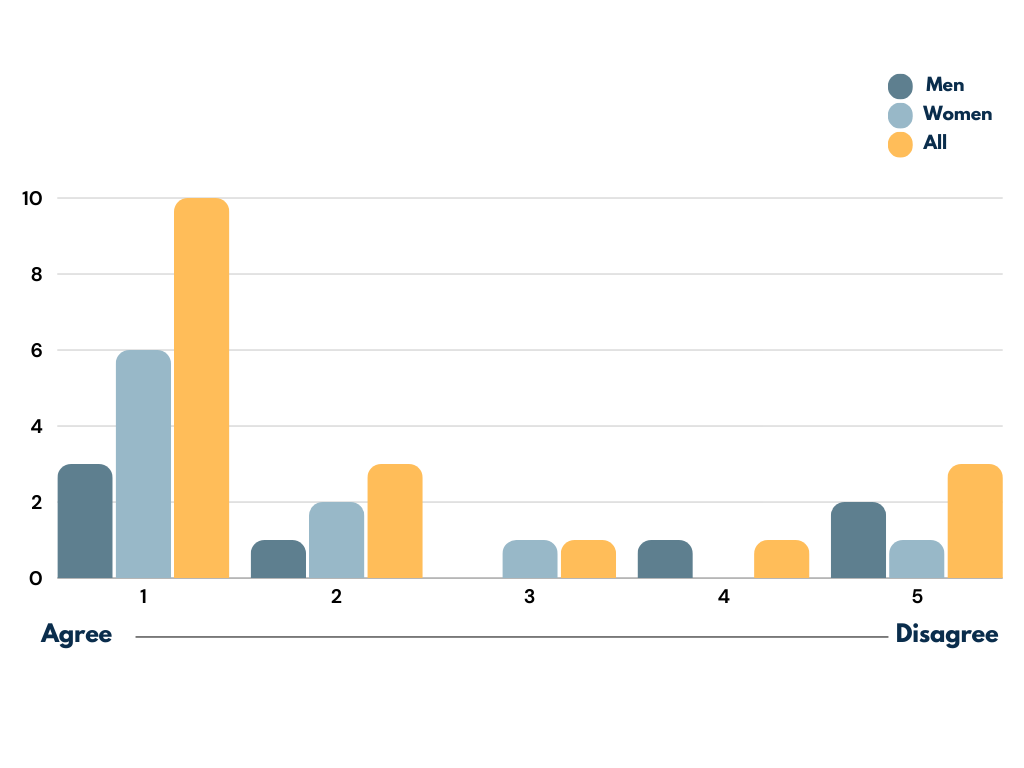

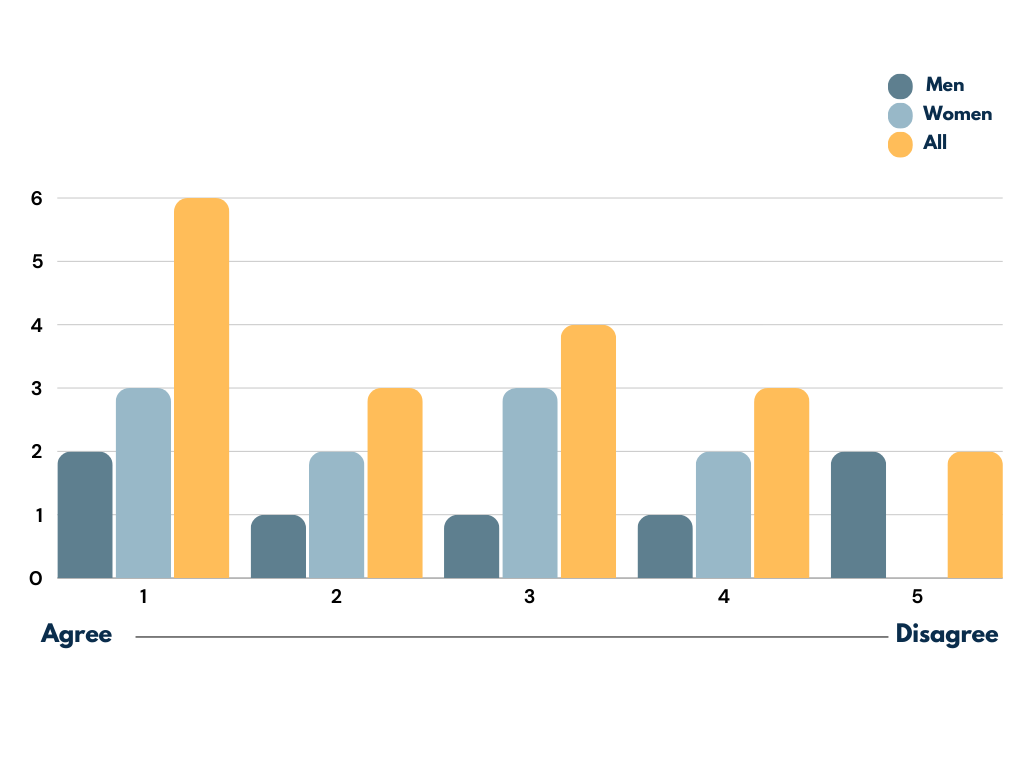
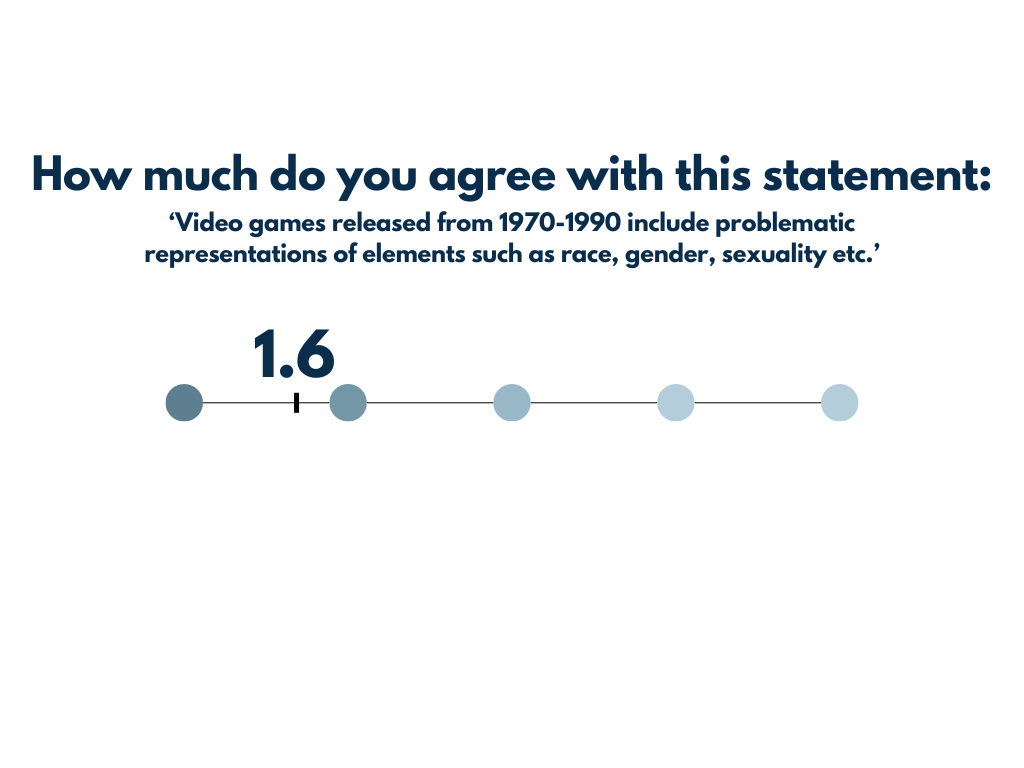
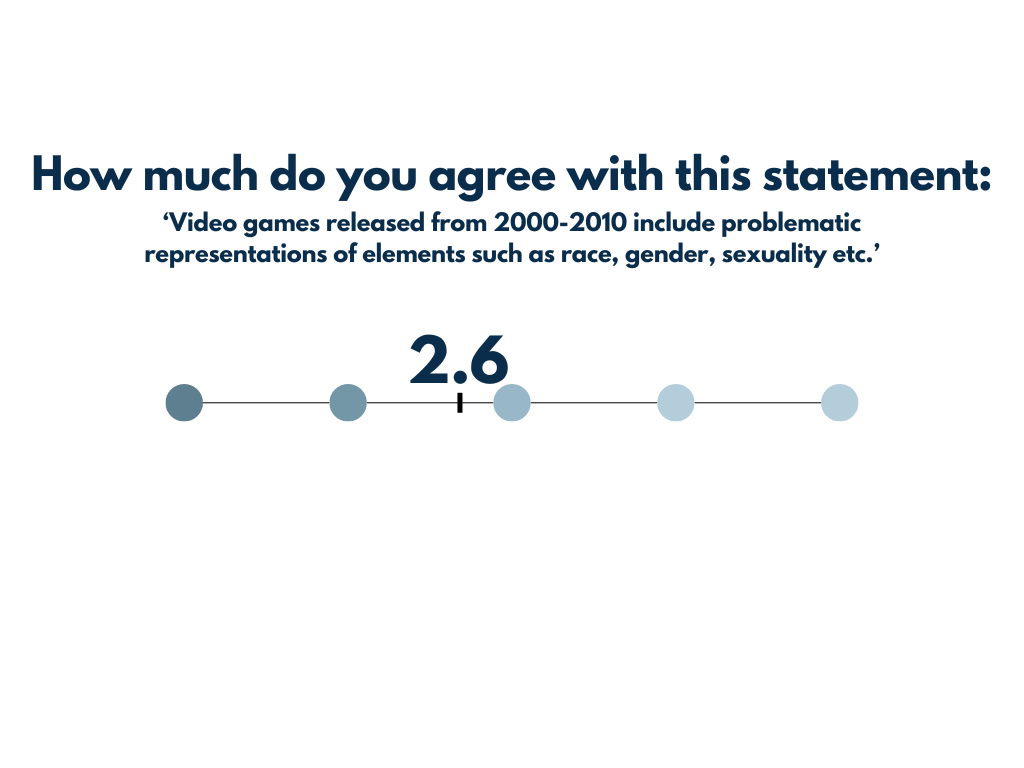
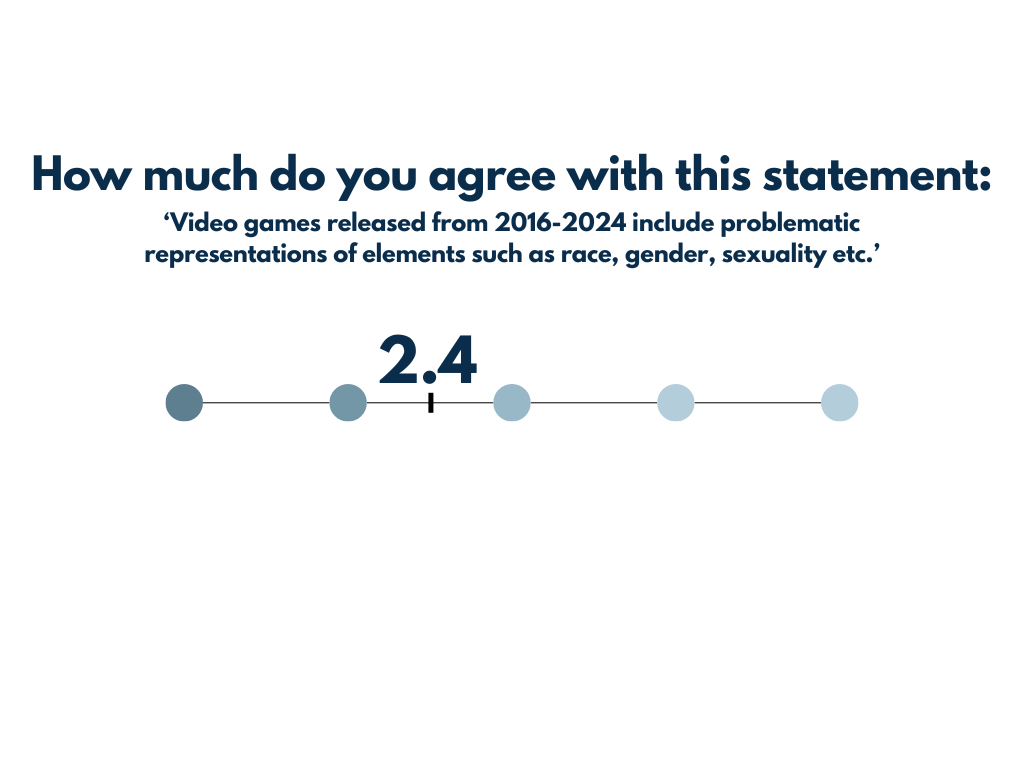
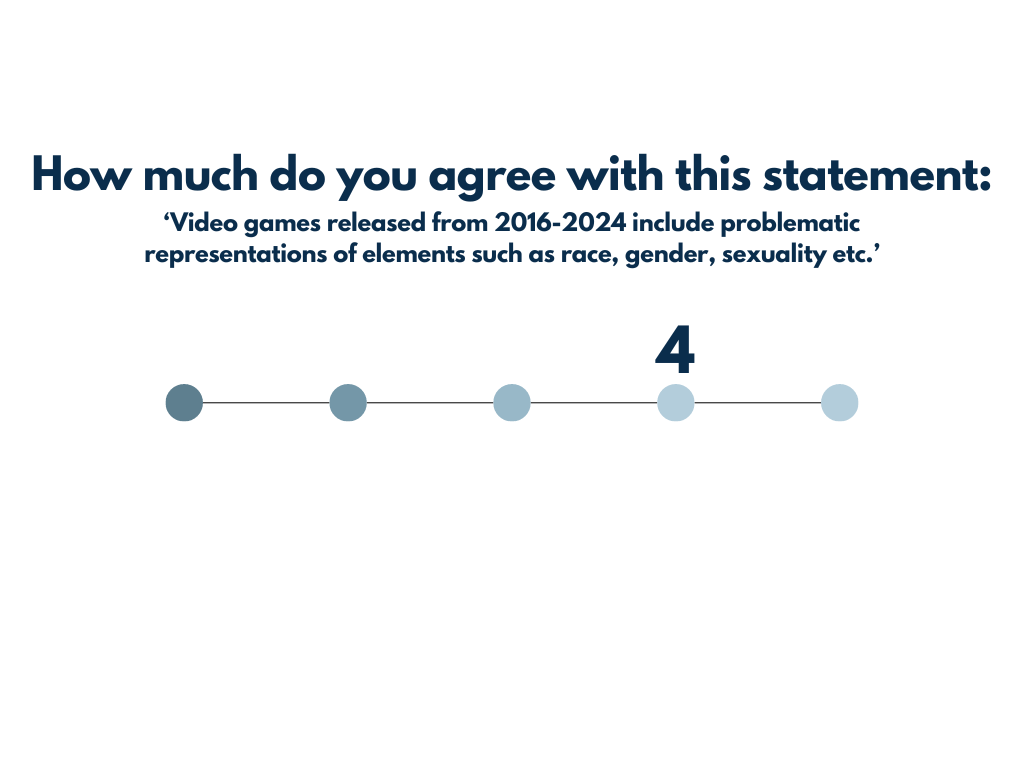
How much do you agree with this statement?
Participants chose a number between 1 to 5. Answering 1 meant that they agreed with the statement and 5 meant that they disagreed.
The question was the same each time, ‘Video games released from ____ to ____ include problematic representations of elements such as race, gender, sexuality etc.’ However, I changed the time frame in each iteration of the question. This was to discover whether or not participants agreed that representations in video games have improved over time as shown in my case study results. I separated these results into age groups rather than gender since, in my case study (Appendix 12), my results revealed that older gamers do not care as much about positive representations in video games. This is because they have become desensitised to problematic representations in video games since many older titles include harmful portrayals of certain demographics.
1970-1990
18-21 yrs participants’ answers:

22-26 yrs participants’ answers:
27-30 yrs participants’ answers:

1990-2000
18-21 yrs participants’ answers:
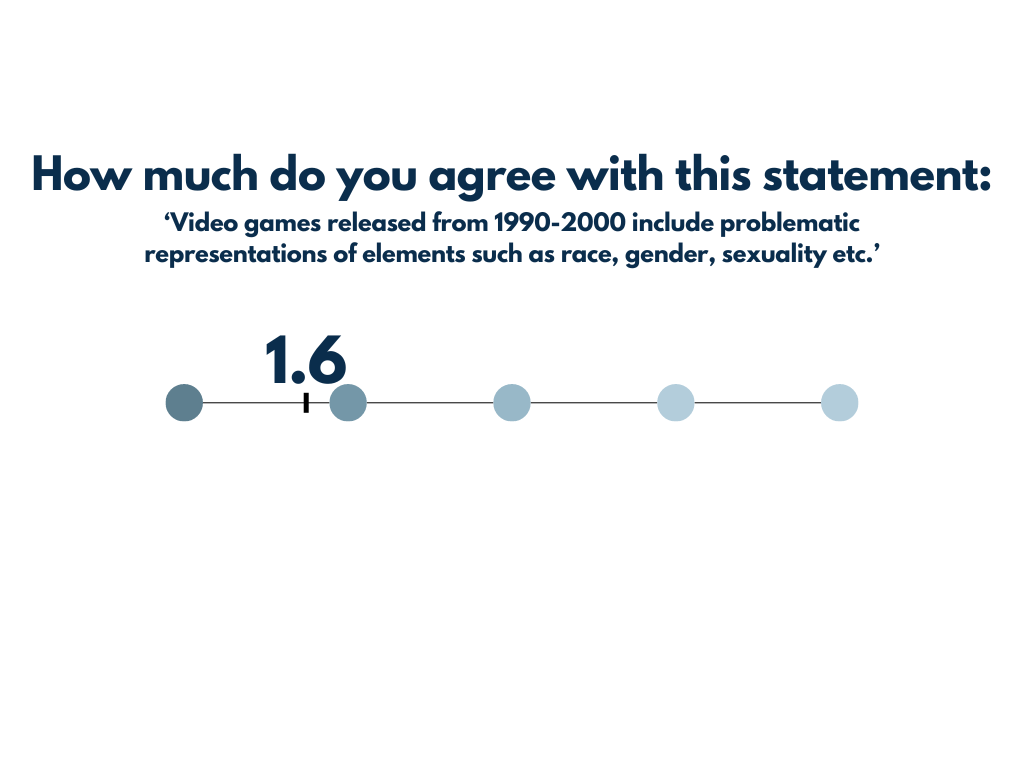

22-26 yrs participants’ answers:
27-30 yrs participants’ answers:

2000-2010
18-21 yrs participants’ answers:
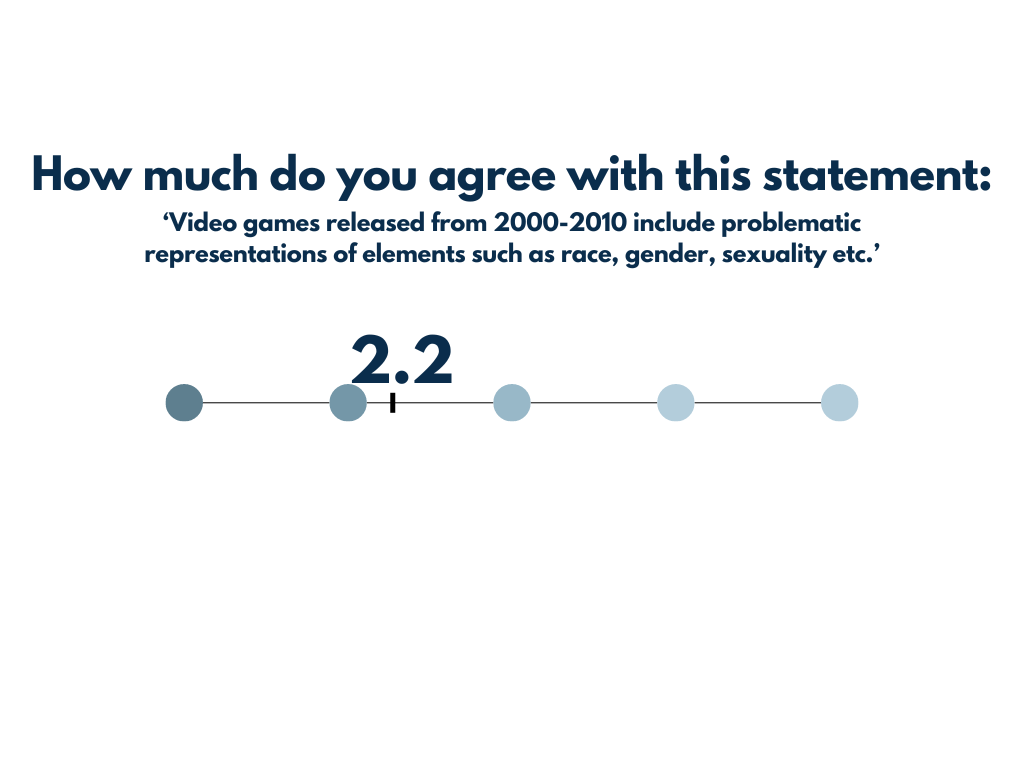
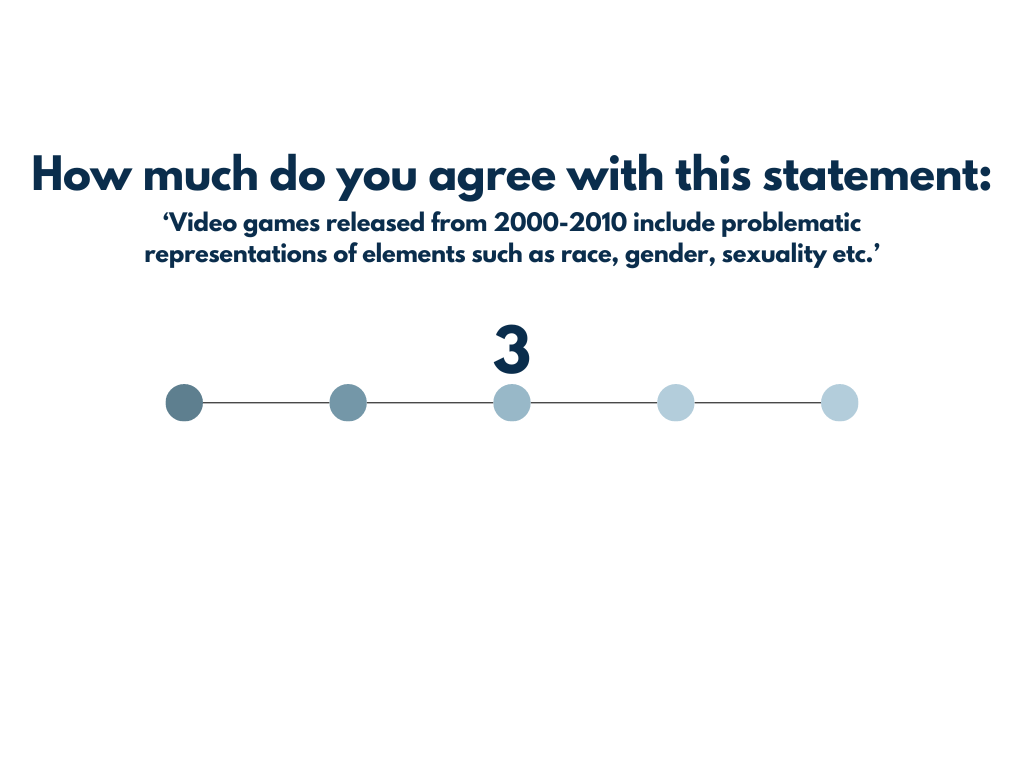
22-26 yrs participants’ answers:
27-30 yrs participants’ answers:
2010-2015
18-21 yrs participants’ answers:


22-26 yrs participants’ answers:
27-30 yrs participants’ answers:

2016-2024
18-21 yrs participants’ answers:
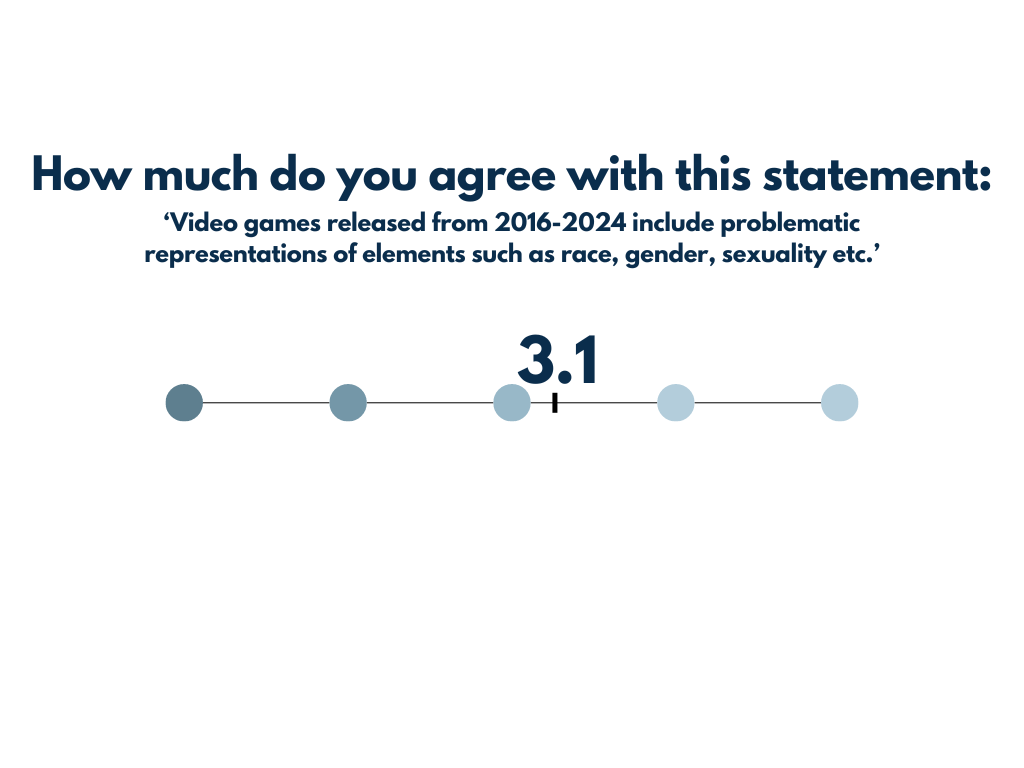
22-26 yrs participants’ answers:
27-30 yrs participants’ answers:
Appendix:


Appendix 10- Ethics Form 1.
Appendix 13- the survey questions.
Appendix 11- Ethics Form 3.
Appendix 14- the survey responses.
Appendix 12- My Case study from semester 1.